HR Reports and Analytics Software Built to Answer Questions Before You Ask Them
Five exported tabs. One rushed deck. Every meeting. Zunoy's HR reports and analytics software ends that loop — live KPIs, visual breakdowns, and scheduled reports that land in the right inbox without HR touching them again.
Why It Matters
A Spreadsheet Answers One Question. This Answers the Next Ten.
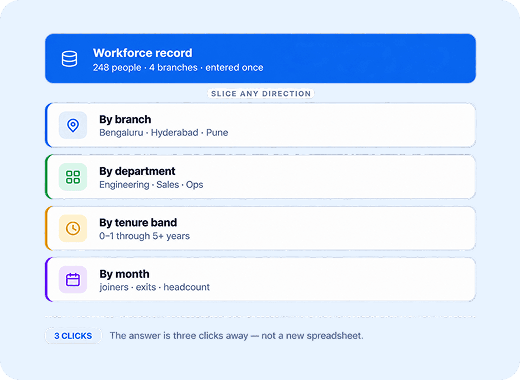
Spreadsheets answer the question you built them for — not the one your Finance Officer asks mid-meeting. HRMS reporting software holds the raw data once and lets you slice it any direction a conversation demands: by branch, department, tenure band, or month.The moment someone asks a question nobody prepared a slide for, the answer is three clicks away — not a new spreadsheet.
Workforce Numbers
Five KPIs. Six Charts. One View.
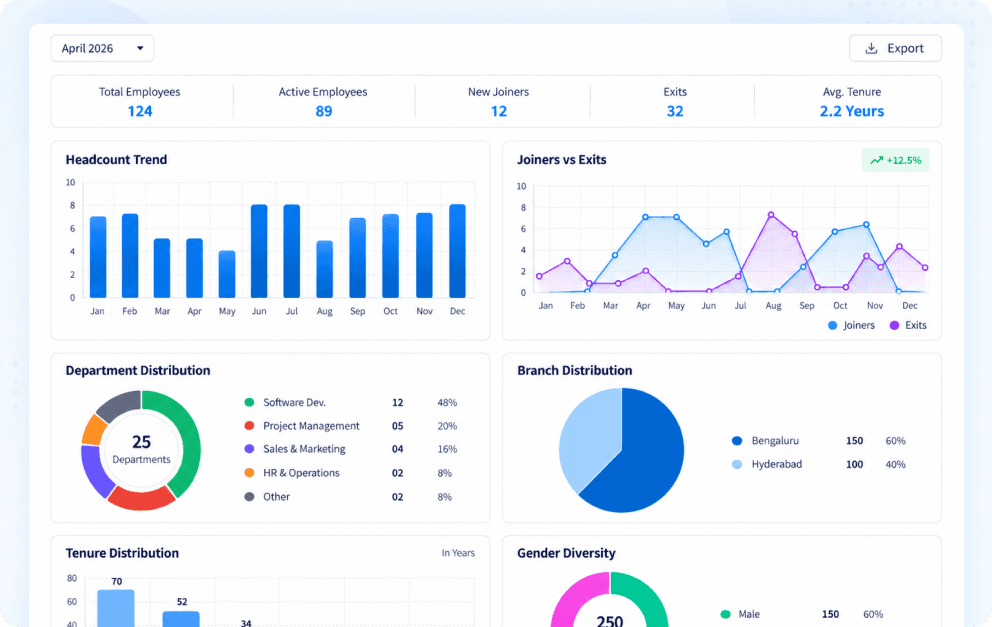
Total employees, active count, joiners, exits, average tenure — sitting above six charts that explain the why behind every number.
Headcount & Tenure Trends
Monthly bar chart tracks headcount across the year
Tenure distribution breaks into yearly bands — under one year through five-plus
See not just how many people you have, but how long they actually stay
Joiners vs. Exits
A multi-line graph compares hires against departures month over month
A spike in exits gets caught before it becomes a pattern
A hiring slowdown shows up before it becomes a resourcing crisis
Department, Branch & Diversity Split
Donut and pie charts break the org down by department, office location, and gender
The workforce analytics view India's HR teams need
No pulling three separate reports and manually combining them
Live Org View
An Org Chart That Draws Itself
Every promotion, transfer, and new hire updates the reporting tree automatically. Not a PowerPoint someone redraws twice a year — an interactive hierarchy that reflects who reports to whom right now.

Updates on every org change
Reflects who reports to whom right now, not who did in January.

Click any node to roll up its details
Direct reports, tenure, and department come with it.

Not a picture — a live view of the company
No file to redistribute, no version to explain in a meeting.
Reports, Automated
Reports That Build and Send Themselves
From a one-off export to a report that lands in someone's inbox every Monday — set once, runs on its own.

Flexible Exports
Attendance, leave, employee database, and asset reports — filtered by branch, department, or date range — exported as CSV, PDF, Excel, or HTML. Whatever format the auditor actually asked for.

Compliance Reports
Monthly and daily attendance, roster, late-arrival, and role reports pre-structured with the fields payroll and compliance teams ask for. Present, absent, overtime, late coming — one export, not five.

Audit Log
Every scheduled report is logged — who generated it, when, with what filters, and whether it's ready, processing, or failed. Nothing sent ever goes unaccounted for.
FAQs
What Teams Ask Before They Stop Exporting Spreadsheets
What is HR reports and analytics software and who is it built for?
HR reports and analytics software centralizes workforce data into live dashboards, visual breakdowns, and scheduled reports — replacing manual spreadsheet exports. It's built for HR Managers, Branch Managers, and leadership who need headcount, tenure, exit, and compliance data on demand, without rebuilding a pivot table every time a new question lands in a meeting.
What core HR metrics does the analytics dashboard track?
Total employees, active count, new joiners, exits, and average tenure sit at the top level. Below that, six charts break down headcount trends, tenure distribution, joiners vs. exits month over month, and department, branch, and gender splits. Every number is live — pulled from the same data layer, not a cached export from last week.
What does the joiners vs. exits chart actually tell HR teams?
It maps hires against departures month over month on a single graph. A spike in exits visible three months before it compounds gives HR time to investigate root cause. A hiring slowdown shows up as a trend, not a surprise. The chart turns reactive reporting into early visibility on workforce movement.
How is Zunoy's HRMS reporting software different from running reports in a spreadsheet?
A spreadsheet answers the question it was built for. HRMS reporting software holds the raw data once and lets you filter it any direction — by branch, department, tenure band, gender, or date range — without rebuilding anything. The moment someone asks an unplanned question, the answer is already there. No export, no merge, no formatting required.
How does the HR analytics dashboard help India-based teams with multi-branch reporting?
Every chart and KPI is filterable by branch. Department distribution, headcount, and tenure data all slice by office location — so a team managing Bengaluru, Hyderabad, and Pune simultaneously sees each branch's numbers independently or consolidated. No separate reports per region, no manual combining of location-level data.
How does the asset analytics module connect to HR data?
Asset data — laptops, monitors, mobiles — is tracked using the same KPI-plus-chart pattern as headcount. Allocation by department, asset age, and employee ownership spread all pull from the same system. IT and HR see identical numbers instead of maintaining two separate spreadsheets that never quite match at budget review time.
The Report Nobody Has to Remember to Send
The HR reports and analytics software that India's people teams rely on shouldn't depend on someone remembering to hit export. Set the schedule, pick the recipients, and the numbers show up — every week, every month, without a single follow-up. HR Managers, Admins, and Branch Managers each get exactly what's relevant to them. Nothing more.

HRMS
Manage your workforce -- attendance, payroll, and leave, all in one place.
Operational
Mail Us
support@zunoy.com
Copyright © 2026 - Mentcube Innovations Pvt Ltd.. All Rights Reserved.
v0.1.227