The Employee Wellbeing Platform That Notices Burnout Before an Exit Interview Does
A weekly mood tap, a workload check, and the analytics to spot the pattern — wellbeing that's tracked continuously, not guessed at once a year.
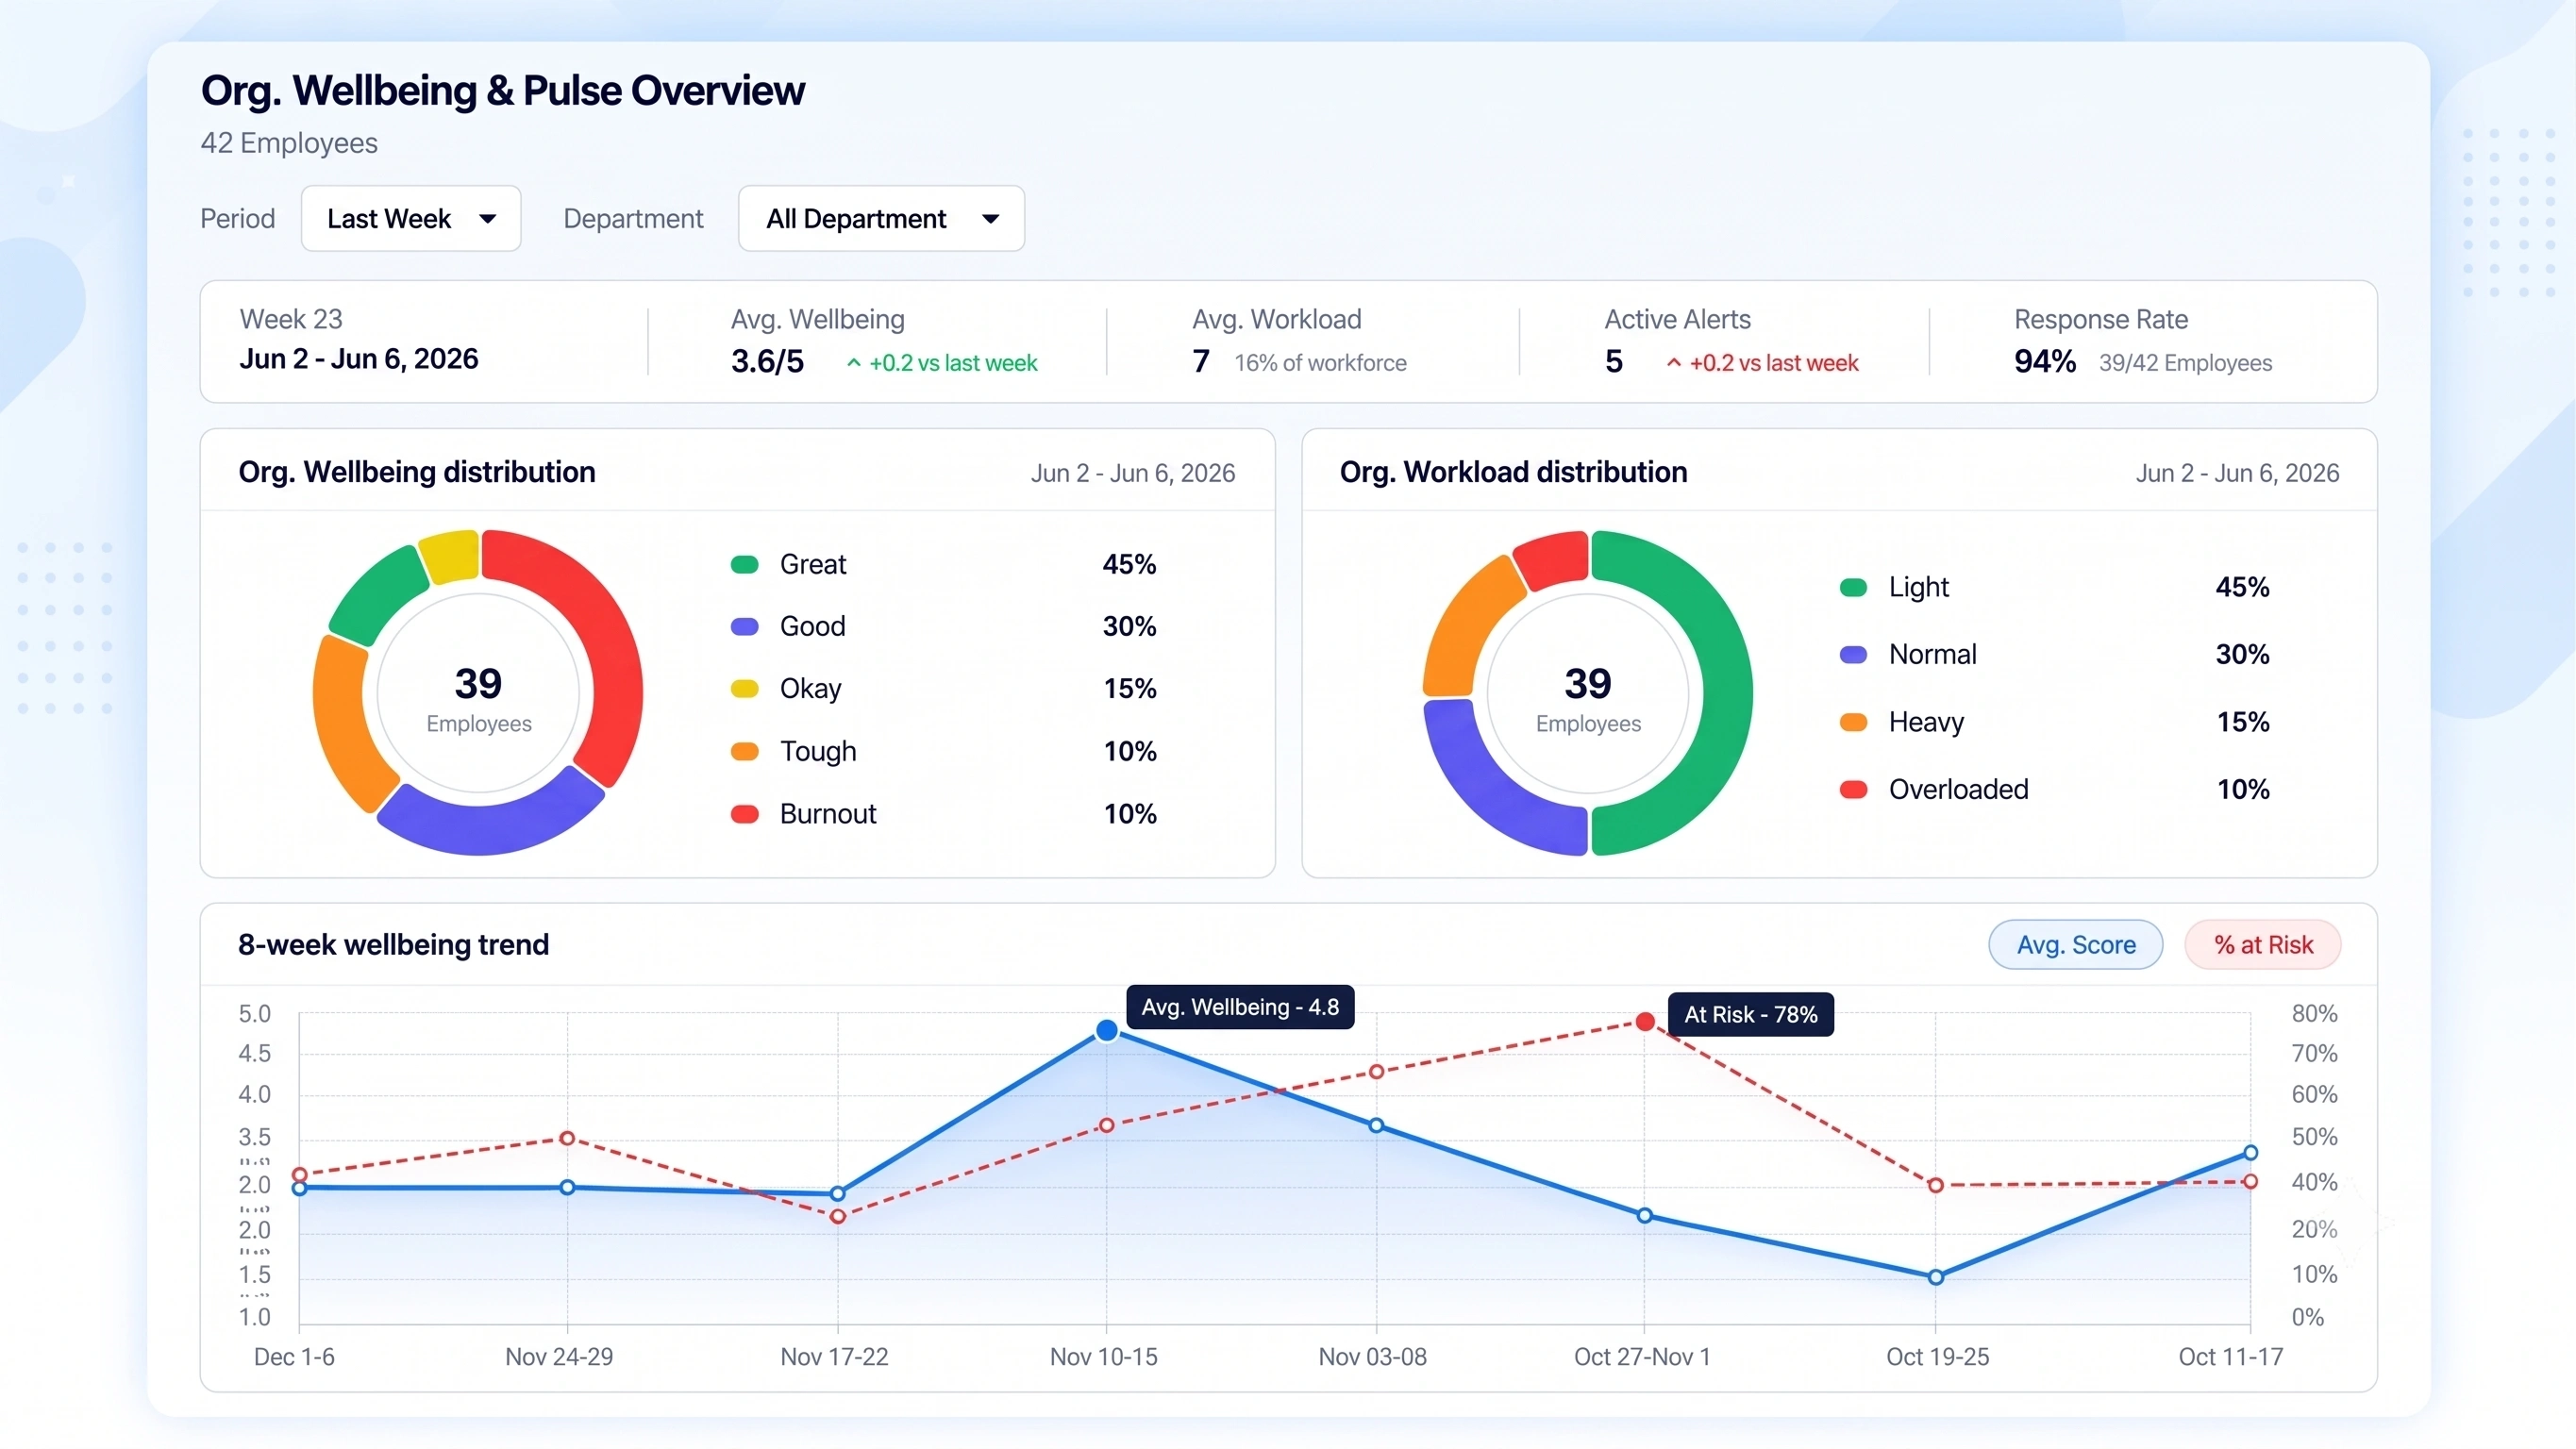
THREE LAYERS, ONE SIGNAL
From a Single Tap to a Pattern Worth Acting On
A wellbeing platform that only checks in annually misses everything that happens between January and December. Zunoy connects three systems, each catching a different stage of the same signal.

Pulse Check-Ins
Weekly mood and workload taps, optional comments, and anonymity where it's needed.

Burnout Analytics
8-week department heatmaps and automated workload mismatch alerts.

Analytics & Reports
Organization-wide sentiment overviews, trend graphs, and department drill-downs.
BUILT TO NOTICE
Employee Pulse Survey Software That Catches the Person the Team Average Hides
A single company-wide sentiment score can look perfectly fine while one person is quietly drowning. As a complete workforce health platform, Zunoy tracks both the average and the outlier.

Weekly, Not Annual
Sentiment captured every week, not once a year.

Individual and Team View
Mood tracked alongside team baselines, not in isolation.

Automated Anomaly Detection
Mismatches flagged before they turn into a resignation.

Anonymous When It Matters
Honesty protected through optional anonymity toggles.
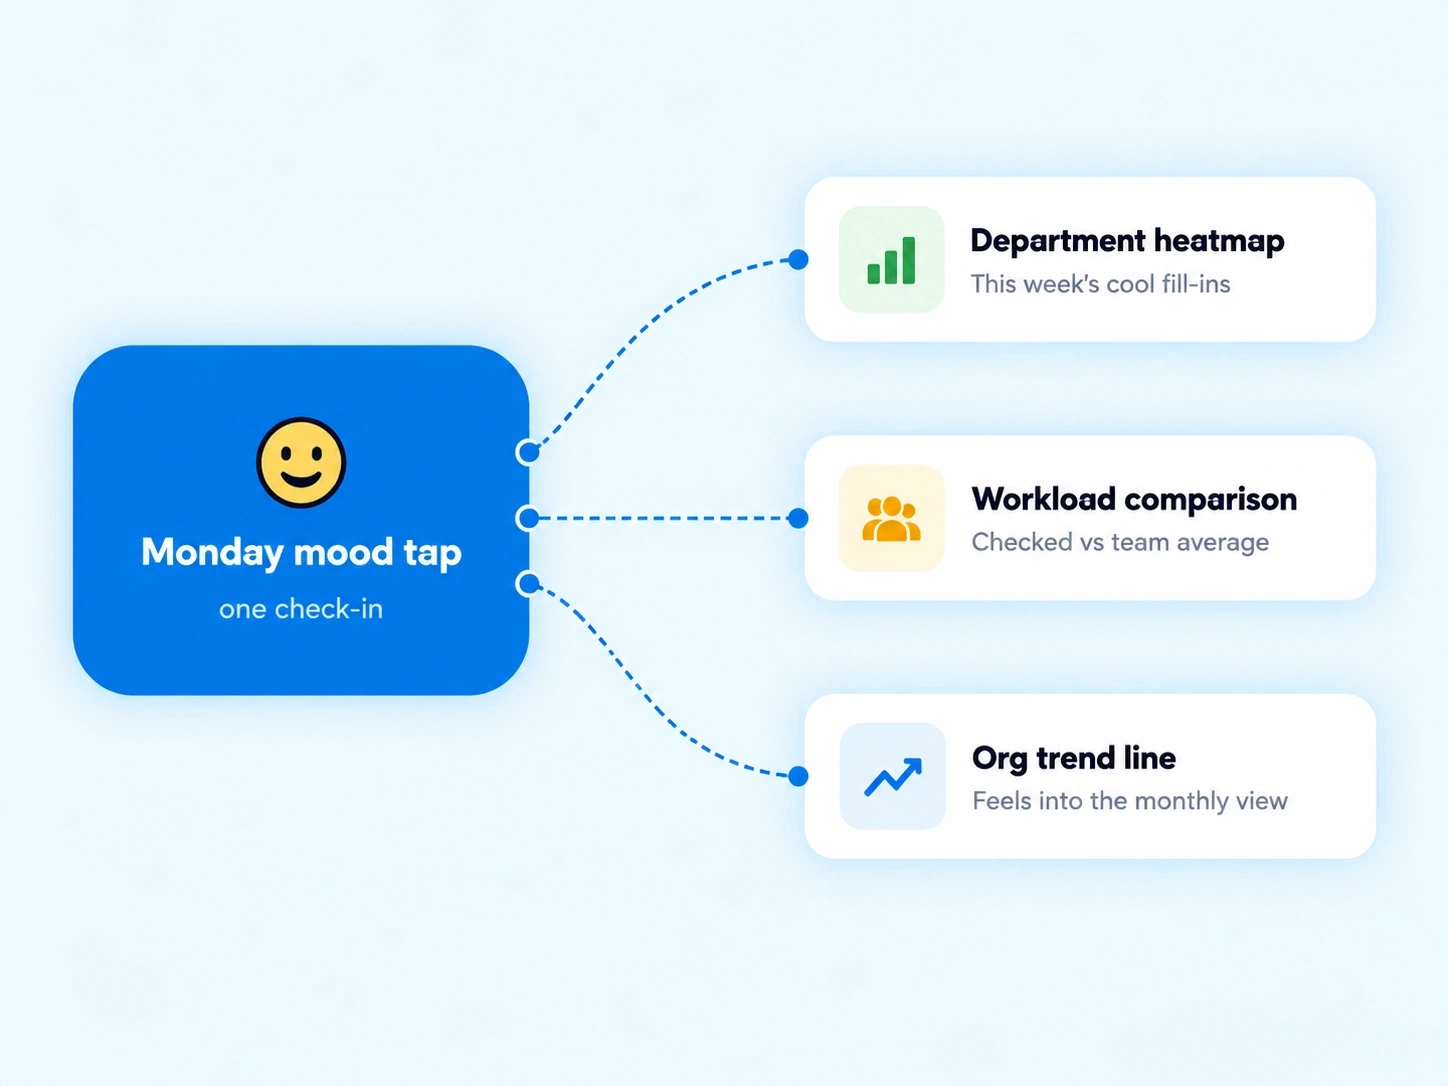
ONE TAP, FULL PICTURE
A Single Weekly Check-In Feeds Every Other Part of This Module
An employee's Monday mood tap doesn't just disappear into a database. It feeds the department heatmap, gets compared against the team's workload average, and rolls into the organization-wide trend line — one small action, contributing to a much bigger picture.

One check-in updates individual, team, and org-level views
Anomalies detected automatically, without manual review
Trends visible over weeks and months, not just today
EVERY LEVEL, COVERED
Because Wellbeing Data Means Something Different at Every Level
Employee sentiment analysis has to work for the individual, the team, and the whole company at once.

Individual
A private, honest weekly check-in.

Team
Workload and mood baselines compared within a department.

Manager
Alerts delivered where they’ll actually be seen.

Organization
Company-wide trends visible to leadership.
TAP TO ACTION
From One Weekly Prompt to an Organization-Wide View
One tap on Monday becomes a leadership dashboard by month-end.
QUESTIONS, ANSWERED
Frequently Asked Questions
What is an employee wellbeing platform?
It’s a system that tracks employee mood, workload, and sentiment continuously through weekly check-ins, burnout analytics, and organization-wide reporting, replacing infrequent formal surveys with ongoing, actionable wellbeing data.
What does employee sentiment analysis actually track?
It tracks weekly mood and workload data, comparing individual responses against team baselines to detect patterns and anomalies that a single sentiment score alone wouldn’t reveal.
How does this detect burnout before it becomes a resignation?
Workload Mismatch Pattern Alerts automatically flag anomalies, such as an individual reporting Overloaded while their team average is Light, surfacing early warning signs managers might otherwise miss.
How is this different from basic employee pulse survey software?
Basic pulse tools only collect responses. Zunoy connects those responses to burnout detection and organization-wide analytics, functioning as a complete wellbeing system rather than a standalone survey tool.
Can managers see how their specific team is doing?
Yes, Department Drill-Downs provide detailed roster analytics, showing team engagement scores and participation counts, giving managers visibility beyond just an organization-wide average.
Is this considered a workforce health platform?
Yes, by combining check-ins, burnout detection, and organization-wide reporting, it functions as a complete workforce health platform rather than a single-feature tool.
One Wellbeing Platform. Every Signal, From One Tap to the Whole Organization.
Weekly check-ins, burnout detection, and organization-wide trends — connected, so nobody’s “Overloaded” gets lost in a “Light” team average.
Pulse Check-Ins
Burnout Analytics
Analytics & Reports