Burnout Tracking Software That Spots the Mismatch Before It Becomes a Resignation
Eight weeks of department trends, automated anomaly alerts, and notifications routed exactly where your managers actually look.
Three Layers, Early Warning
From a Single Data Point to a Pattern Worth Acting On

8-Week Department Heatmaps
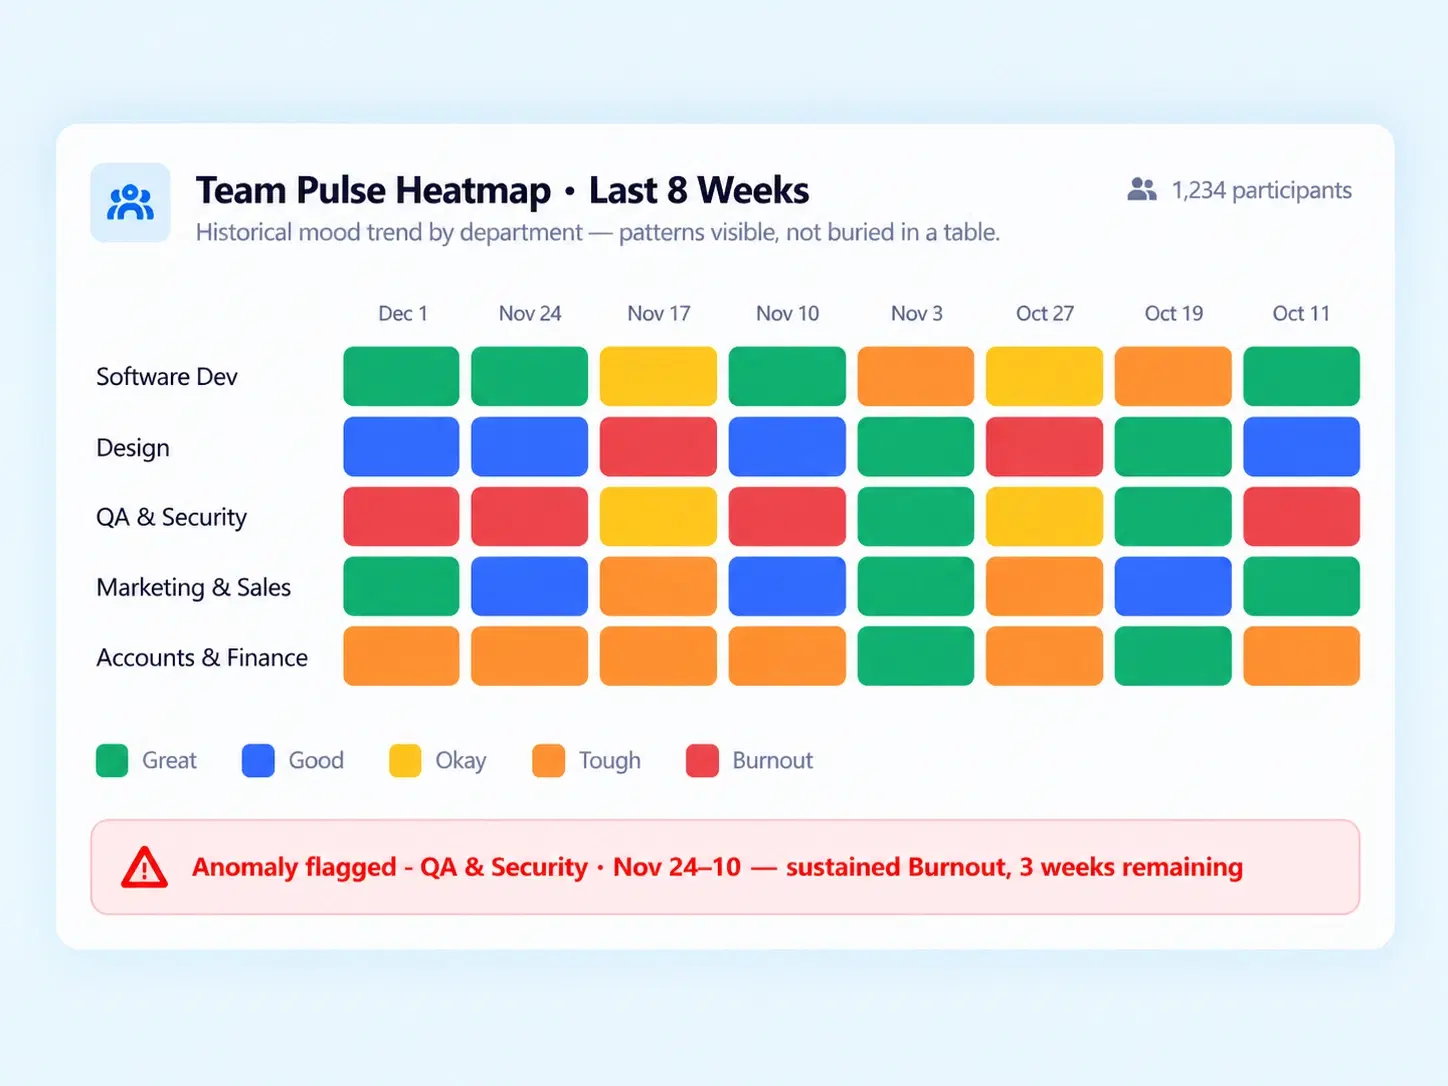
Visual grids tracking historical trends across departments like Software Development and Design, so patterns are visible, not buried in a table.

Workload Mismatch Pattern Alerts
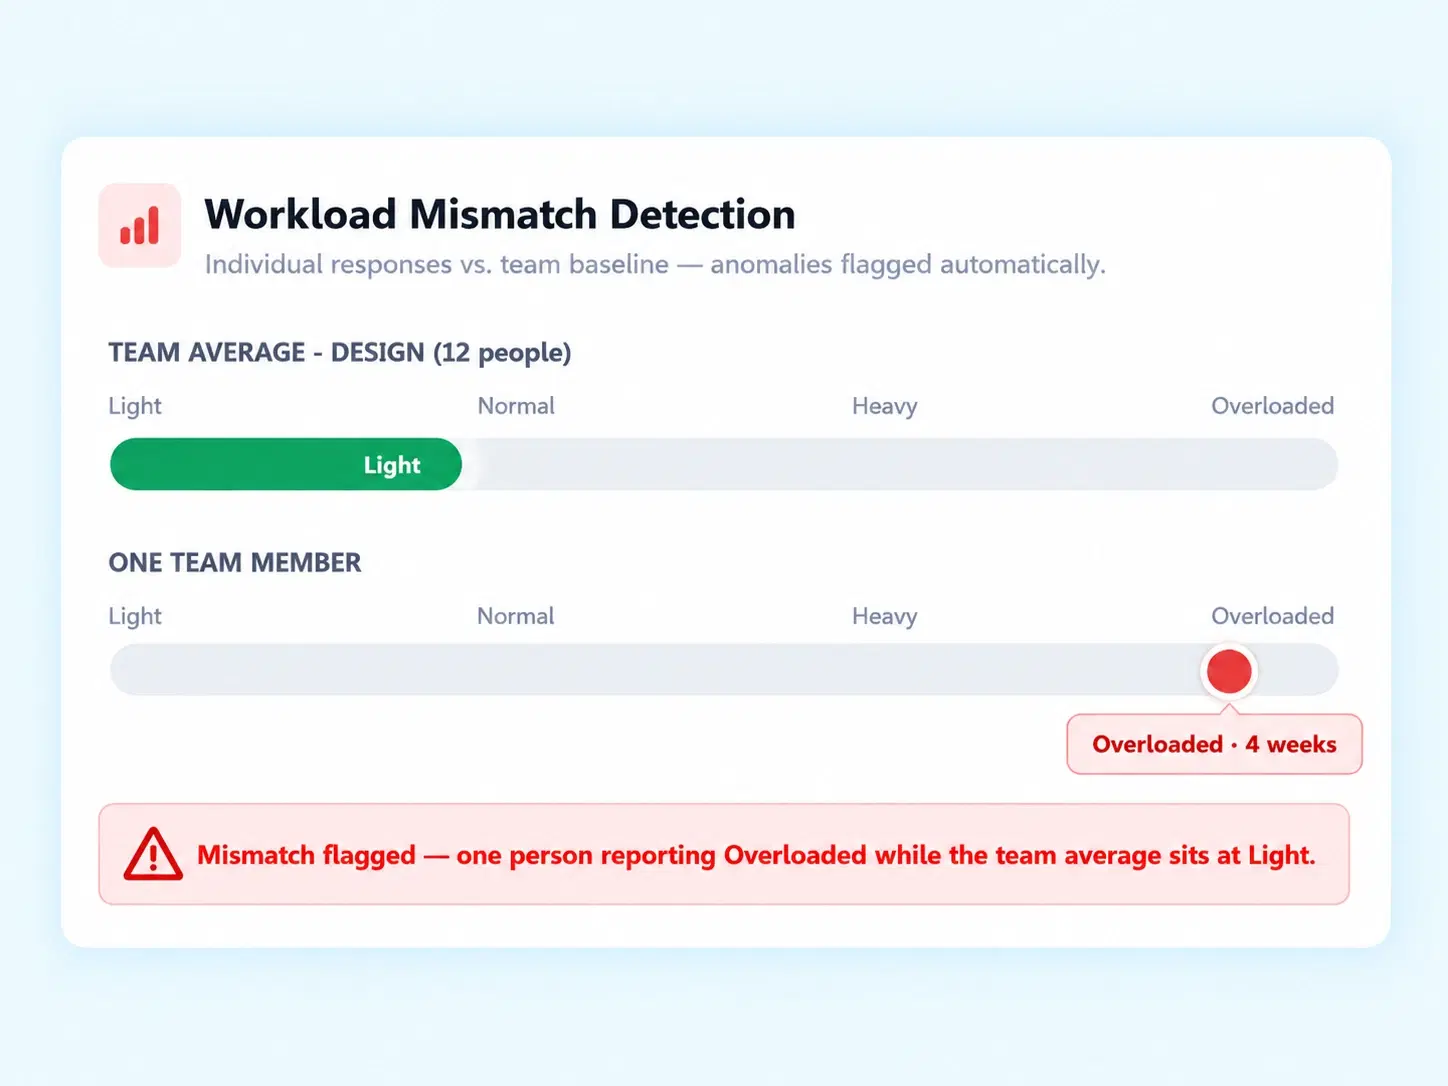
Automated detection flags anomalies — like an individual reporting Overloaded while their team average sits at Light.

Alert Delivery Channels
Route mismatch notifications through Slack, Email, or in-app notification, wherever your managers are most likely to see them.
One Person, Off-Pattern
Employee Burnout Analytics That Notice the One Person Everyone Else Missed
A team average of "Light" workload can hide one person quietly drowning. Workload Mismatch Pattern Alerts compare individual responses against the team baseline automatically, surfacing exactly the kind of anomaly — someone reporting Overloaded while everyone around them reports Light — that's easy to miss in a summary view.
Individual responses compared against team averages
Automatic flagging of statistical anomalies
Surfaces outliers a summary view would hide
Eight Weeks, Visible
A Workload Management Tool That Shows the Shape of a Trend, Not Just Today
One bad week is noise. Eight weeks of the same color on a heatmap is a signal.

Department-Level Heatmaps
Compare trends across teams like Software Development and Design side by side.

Historical Depth
Eight weeks of data, enough to separate a bad day from a bad pattern.

Color-Coded Clarity
Trends readable at a glance, without opening a single report.

Cross-Department Comparison
See which teams are trending worse before it's raised in a meeting.
Delivered, Not Buried
Team Burnout Prevention Starts With Alerts That Actually Get Seen
Questions, Answered
Frequently Asked Questions
What is burnout tracking software?
It's a system that analyzes employee workload and sentiment data over time, using heatmaps and automated alerts to identify burnout patterns before they escalate into disengagement or resignation.
What triggers a workload mismatch alert?
An alert triggers when an individual's reported workload significantly differs from their team's average, such as someone reporting Overloaded while the team average sits at Light.
Is this considered employee burnout analytics?
Yes, it functions as complete employee burnout analytics, combining trend visualization and anomaly detection to surface patterns individual data points alone wouldn't reveal.
How do the department heatmaps work?
They display 8 weeks of historical trend data across departments like Software Development and Design, using color coding to make patterns visually obvious without reading raw numbers.
Can alerts be sent through Slack?
Yes, Alert Delivery Channels support Slack, Email, or in-app notifications, so mismatch alerts reach managers through whichever channel their team already uses regularly.
How far back does the heatmap data go?
Heatmaps display 8 weeks of historical trends by default, giving enough depth to distinguish a temporary rough patch from a sustained, concerning pattern.
Catch the Pattern Before It Becomes an Exit Interview
Eight weeks of trends, automated mismatch detection, and alerts delivered exactly where your managers will see them.
Department Heatmaps
Mismatch Alerts
Slack / Email / In-App

HRMS
Manage your workforce -- attendance, payroll, and leave, all in one place.
Operational
Mail Us
support@zunoy.com
Copyright © 2026 - Mentcube Innovations Pvt Ltd.. All Rights Reserved.
v0.1.227