Employee Wellbeing Analytics That Turn a Thousand Weekly Taps Into One Clear Picture
Company-wide KPIs, trend lines, department drill-downs — everything your pulse check-ins collected, finally readable in one dashboard.
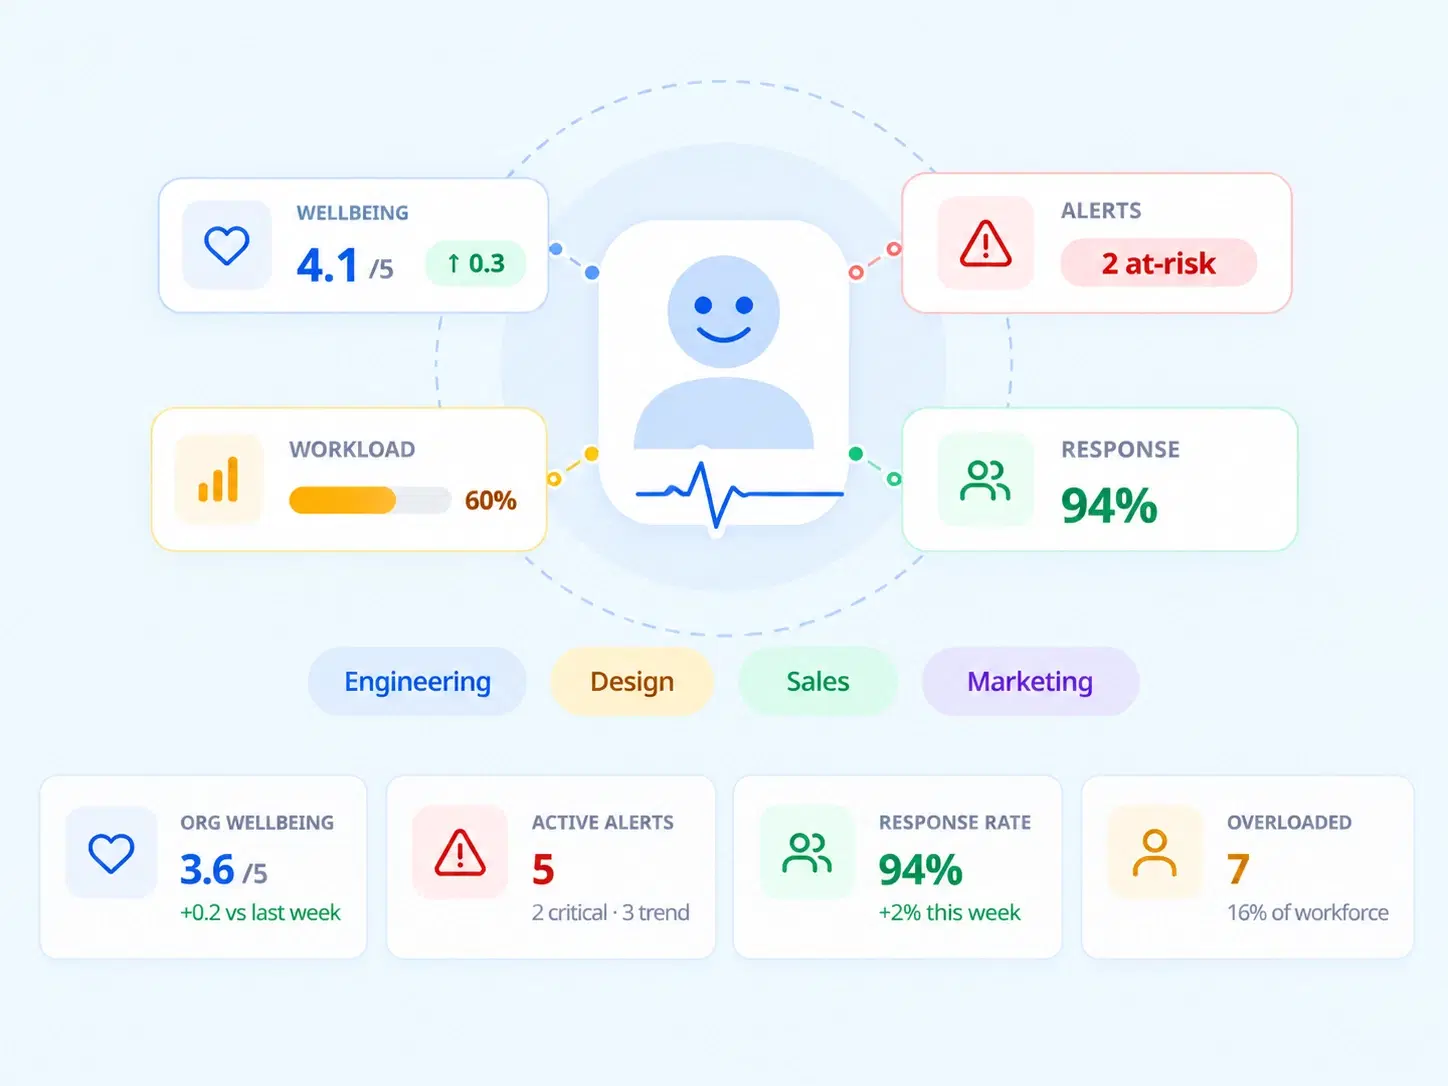
FOUR VIEWS, ONE STORY
Everything Sentiment Data Can Tell You, Organized Into One Dashboard
Raw check-in responses mean little on their own. Zunoy turns them into four connected views, each answering a different question.

Organization-Wide Pulse Overview
High-level KPI distribution through bar and donut charts, showing company sentiment at a glance.

Trend Line Graphs
Longitudinal sentiment tracking across multi-week and multi-month timelines.

Department Drill-Downs
Detailed roster analytics on team engagement scores and participation counts.

Global Settings Controls
Master toggles for modules, mandatory check-ins, and manager-versus-individual privacy rules.
NOW, IN CONTEXT
Employee Sentiment Analysis That Shows the Curve, Not Just Today’s Number
A single sentiment score answers “how is everyone today.” Trend Line Graphs answer the more useful question — how has that number moved across weeks and months. A dip that looks alarming in isolation might just be a seasonal pattern once it’s plotted against the last quarter.
Multi-week and multi-month sentiment tracking
Longitudinal view instead of isolated snapshots
Patterns visible across entire timelines, not single dates
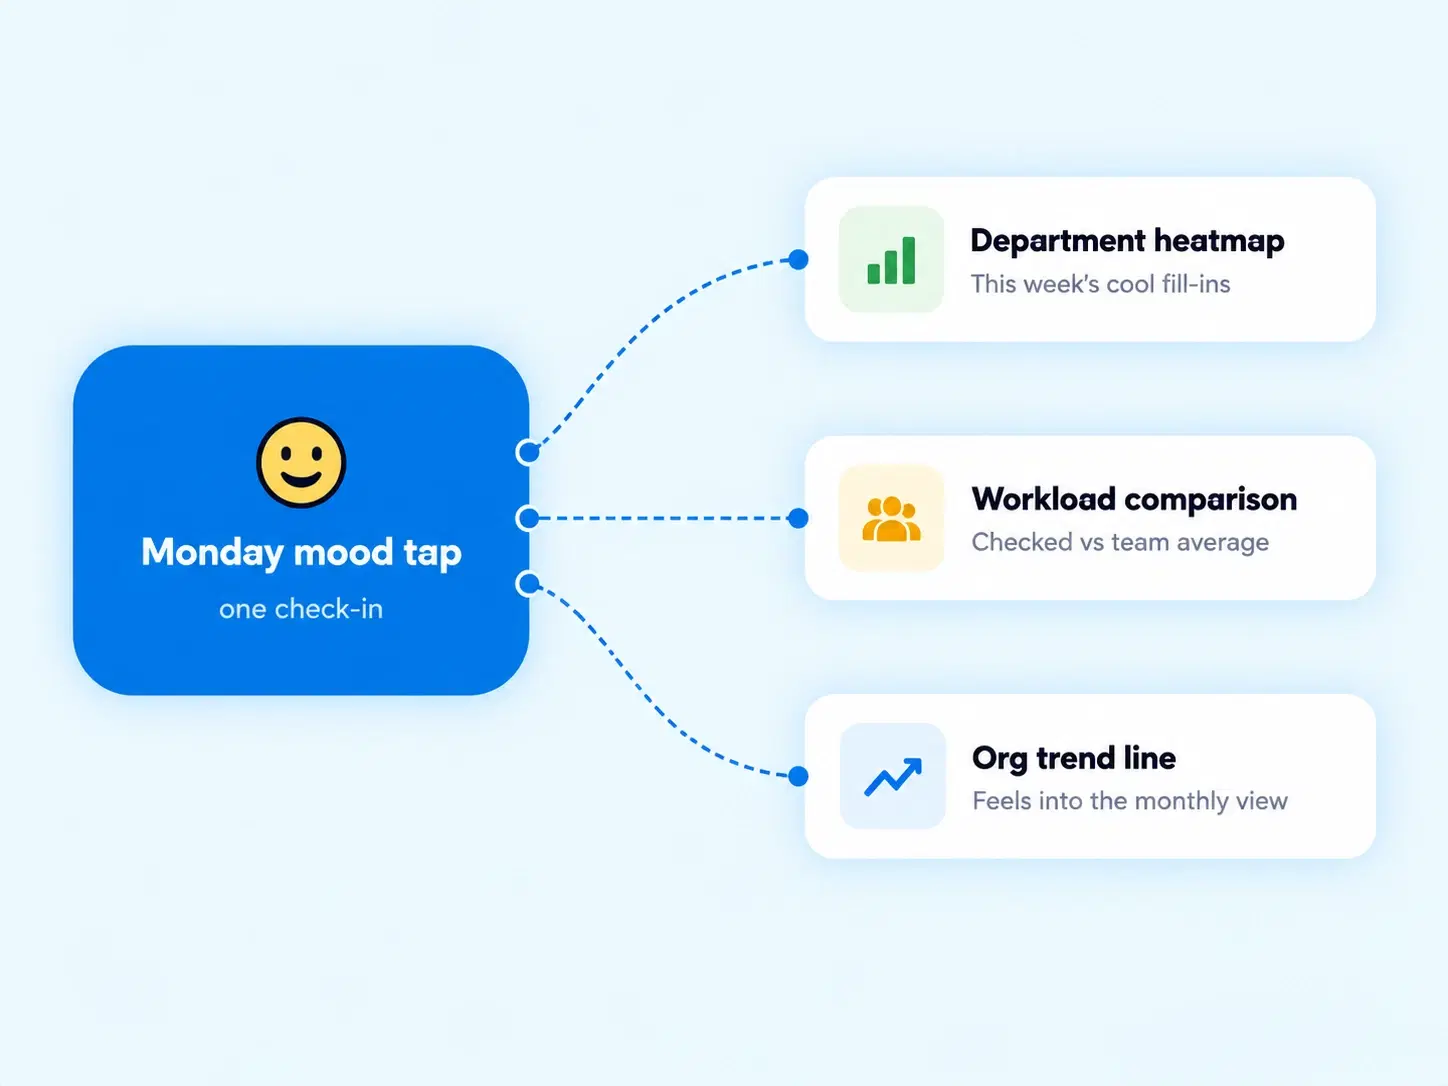
ZOOM IN, TEAM BY TEAM
What a Department Drill-Down Actually Reveals
THE WHOLE PICTURE
HR Wellbeing Dashboard Charts Built to Be Read in Under a Minute
Bar charts and donut charts distribute the same data two different ways, so whichever view clicks faster is already there.
KPI Distribution Charts
Bar and donut visualizations of company-wide sentiment.

At-a-Glance Reading
No need to interpret raw numbers manually.
Organization-Level Snapshot
See overall sentiment before drilling into any specific team.

Consistent Visual Language
Same chart types used across every reporting view.
CONFIGURED, RESPECTED
Workforce Health Metrics Collected Without Compromising Individual Privacy
QUESTIONS, ANSWERED
Frequently Asked Questions
What is employee wellbeing analytics?
It’s a reporting system that aggregates pulse check-in and sentiment data into visual dashboards, showing organization-wide trends, department comparisons, and participation metrics instead of raw individual responses.
How far back do trend line graphs go?
Trend Line Graphs support both multi-week and multi-month timelines, allowing longitudinal sentiment tracking that reveals patterns a single snapshot wouldn’t show.
Is this considered an HR wellbeing dashboard?
Yes, it functions as a complete HR wellbeing dashboard, combining organization-wide overviews, trend graphs, and department-level detail into a single reporting view.
What does the organization-wide pulse overview show?
It displays high-level KPI distribution through bar and donut charts, giving a quick visual read on overall company sentiment without needing to review individual responses.
Can I see sentiment data for a specific department?
Yes, Department Drill-Downs provide detailed roster analytics, including team engagement scores and participation counts, so you can view sentiment at a department-specific level.
How does employee sentiment analysis protect individual privacy?
Global Settings Controls include manager-versus-individual privacy rules, ensuring sentiment analysis can be aggregated and reported without exposing specific individual responses where policy restricts it.
Every Pulse Check-In, Turned Into a Picture Worth Reading
Company-wide overviews, trend lines, and department drill-downs — all in one dashboard, privacy rules respected throughout.
Pulse Overview
Trend Graphs
Department Drill-Downs
Privacy Controls

HRMS
Manage your workforce -- attendance, payroll, and leave, all in one place.
Operational
Mail Us
support@zunoy.com
Copyright © 2026 - Mentcube Innovations Pvt Ltd.. All Rights Reserved.
v0.1.227